Posts

Hedge Fund Currency Trader Tips For Finding Trades

Tips from Art K. Hedge fund currency trader trader gives some tips on how he goes about finding high value / lower risk trades. (circa 2008)  Here are some ideas from Art K. as to how to go about preparing to find a good, high probability entry. He's a serious hedge fund pro.: One of my regular (technical) port of calls is to the Dollar Index to see what that’s up to. It’ll offer a snapshot of $ weakness v/s strength. You might then choose to cherry pick your candidate of choice if it's playing ball & quickly then proceed to leaf through the appropriate pairs to adjudge a likely opportunity. For instance, if the buck is weak v/s the basket, I’d want to be homing in on the candidate which is displaying the dominant & aggressive behavior patterns.  If it’s the Pound, then I’ll trail through the cross instruments associated with the Pound to locate whether it’s also a Pound story (of strength) or exclusive to the buck. I’m always on the hunt for value v/s r

Best Entries for Today

Image
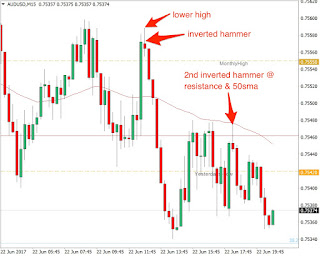
I thought I should post couple of potential entries I spotted but did not enter . Both charts show the potential of price action trading even in tight markets. I generally keep a pretty simple chart with no indicators except a 50sma or 60sma, just horizontal support and resistance levels, previous day's high/low, previous week's high/low, previous month's high/low, and maybe some fibs or trendlines. AUD/USD M15 Chart EUR/USD M15 Chart

Forex Price Action Trading Strategy

Hi all, After a very long absence I've come back to currency trading.  My last account was re-appropriated to fund living expenses after I was diagnosed with stage 3 non-Hodgkin Lymphoma. I was under insured and medical expenses can be onerous at best. I thought I should post my latest price action trading strategy. I've been focusing on short term scalps, trading off the M15 chart for entry signals. Support and resistance levels come from D1 & H1 charts along with fib retracement calcs when appropriate. You'll also see from time to time lines that show the previous day's high/low, previous week's high/low and previous month's high/low. Price Action Strategy Charts Mark nearby round numbers (D1, H1) Mark nearby swing points (D1, H1) Place fibs on chart (H1, 15m) Signals Price @ swing S/R level with hammer or outside engulfing candle Price @ round number S/R level with hammer or outside engulfing candle Price @ 50% or 61.8%

EURGBP Short

Image
OK, here we go. The H4 candle came out a shooting star at resistance. This trade brings with it a bit more risk in being that it's a counter trend trade with the idea that price will come back to the ema mean as shown in the image below: Daily EURGBP chart UPDATE: Got totally whacked on this one. No pullback whatsoever.