Posts

Showing posts from 2008

End of Week...

Thursday and Friday were not good. A few wins mixed in with too many losses. I gave up half my profits from what was a pretty good week up until Thursday evening. Damn, I hate when that happens. I have to say the possibility of a total global financial meltdown loomed heavy in my thoughts. Next week will be another very interesting week. I hope the world economy makes it through. This is truly a very scary financial time. I'm a firm believer that the evidence is overwhelming that when you elect a person(President Bush) and a body of people(U.S. Congress) to a govern the most powerful country on earth that represent a financial ideology instead of the best interests of the constituents, you get a financial disaster like we have now. God help us. It may be all we have left to hope for.
Good Start...

Image
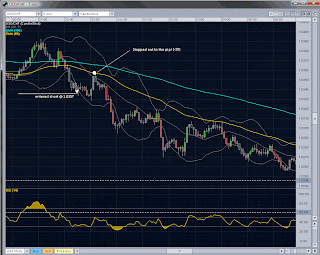
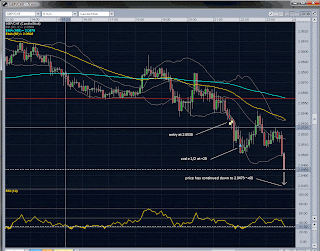
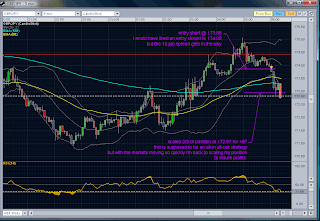
After last night's debacle taking two losses for -122, then a win for +65 which left me -57 in the hole, I latched on to this trade right out of the gate tonight. Nice short entry just below the round number at 173.85 and riding it down to a 2/3 scale out at 172.97 for +87.

Kicking Some Butt...

Image
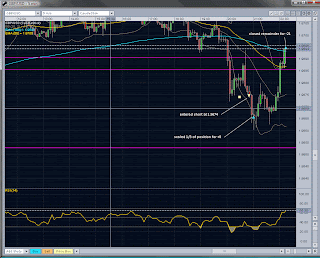
This is a lot like last night. Started off with a -61 loss trying to get short from 180.20. Finally price proved it was really going to go short so I entered at 179.10 and rode it down for a sweet +236.

Great Trade...

Image
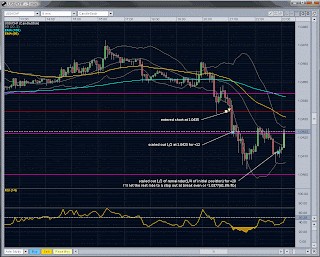
After taking an opening loss for -61(ouch!) I was abe to hop on the move south. Currently sitting on +208 and waiting to see what the London open brings.

Another Winner...

Image
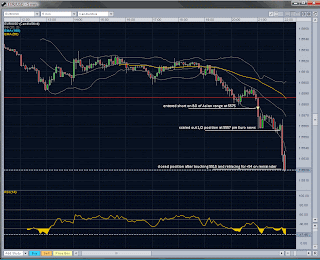
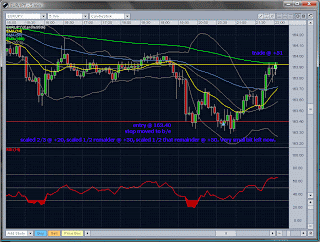
This trade was helped along nicely by very poor UK housing data. Entered at 186.60, scaled off 1/2 position @ +100, stop loss moved to entry. Now awaiting UK PMI data.

Tonight's Trade...

Image
This trade is the result of using the 240-min horizontal support/resistance and hourly trend lines. The idea is to initiate the trade using either rejection or continuation signals at the 240-min horizontal lines in combination with the hourly trend lines. The optimum entry would have been another 20 or so pips lower, but unfortunately yet again, I was unable to be at the screens monitoring the situation.

Landed A Whopper...

Image
This trade was taken as a direct result of the horizontal 4-hr support/resistance lines and trend line confirmation on the 60-min chart. I would have preferred an entry at ~195.00, but instead entered short at 193.90 due to not being at the screens early enough. The news regarding B&B(the UK banking giant) being taken into public ownership(nationalized) certainly did not hurt the situation. In fact, it may have been the gasoline on this fire.

Ready To Get To It...

The past two weeks of learning and testing are finished and I'm ready to get back at it by putting cash on the line. It turns out this strategy demands quite a bit more time from me than the previous Asian session close to London lunch time frame. I'll basically be monitoring the market, in fact the GBP/JPY pair or geppy as it's called, all day. That is if congress comes to some sort of an agreement on the financial rescue/bailout plan before Sunday evening's market opening.

A Word About The Markets...

The market has been pretty much locked in a small range this past week as the U.S. congress tries to pull together some kind of a financial rescue/giveaway plan to save the wealthy citizens of this great country. You know the situation is dire when even free market wingnuts like Larry Kudlow are saying they have no probem with government socialism for the rich every 20-30 years. Make no mistake about it, this current crisis of confidence in the financial system can be placed squarely on the shoulders of Phil Gramm(former U.S. senator) and his conservative cronies, when in December 2000 he slipped the Commodity Futures Modernization Act at the last moment possible into an omnibus spending bill making it's way through congress. The act, he declared, would ensure that neither the SEC nor the Commodity Futures Trading Commission ( CFTC ) got into the business of regulating newfangled financial products called swaps—and would thus "protect financial institutions from overregulatio

More Changes Coming...

I've been working on and testing a new and some what different strategy utilizing 4-hr, 1-hr and 30-min charts. It uses the same support/resistance lines as my previous wider time frame strategy, but the entries are derived from the 1-hr and 30-min charts. Exits are trailed as support or resistance lines are broken and daily ranges are kept in mind. This strategy is mainly used on geppy(GBP/JPY). Stops are typically 50-65 pips. Profits run 100 pips or more. I'll be posting some screen caps of trades in the future.

Not So Good...

This has been a couple of tough nights. Last night was break even, which is better than a loss any day. Tonight is just plain ugly with three trades totaling -68. A little more caution was probably in order since Thursday morning's economic calendar is chock full of important market moving data releases. The great thing about trading is there's always another day.

By The Way...

...this can all be done using any computer hooked to the internets. My broker, Oanda, is a net based java app for entering trades. My charts are from Oanda (java) and ProRealTime (java) charts. For you geeks out there this means you can use Windows, Mac or Linux to power your way to financial freedom. Here's a list of software I use day in, day out to make oodles of cash trading currencies: Oanda(broker) ProRealTime Charts (main charting package) Mozilla Thunderbird (email) Mozilla Firefox 3.0.1 Photoshop, Irfanview(free) or GIMP(free on Linux) for screen capture annotation. Windows Vista or openSUSE Linux

Rolled A Fatty...

Image
This trade was just great. It ran for over 100 pips. I used monthly and 4-hr support/resistance as described in the two previous posts. The chart is notated. Click on it for a larger view:

Tips from Art K.,...

Here are some ideas from Art K. as to how to go about preparing to find a good, high probability entry. He's a serious hedge fund pro.: One of my regular (technical) port of calls is to the Dollar Index to see what that’s up to. It’ll offer a snapshot of $ weakness v/s strength. You might then choose to cherry pick your candidate of choice if it's playing ball & quickly then proceed to leaf through the appropriate pairs to adjudge a likely opportunity. For instance, if the buck is weak v/s the basket, I’d want to be homing in on the candidate which is displaying the dominant & aggressive behavior patterns. If it’s the Pound, then I’ll trail through the cross instruments associated with the Pound to locate whether it’s also a Pound story (of strength) or exclusive to the buck. I’m always on the hunt for value v/s risk. I want an easy life wherever possible. If the buck is mired in heavy range traffic, then I’ll look outside for maybe a decent cross opportunity. Perhaps s

Changes, Always Changes...

Image
I've changed my trading strategy again to include a more overarching way to determine high probability trades. During the past month I ran across some new postings by some old mentors from back east and London. They are employees in a mid sized hedge fund that deals specifically in currencies. In their postings they went over in detail how it is they determine areas(or levels) where they want to get involved in the market. It doesn't matter which currency pair, but they(like me) want to trade the more liquid and volatile instruments(i.e. gbp/usd., gbp/jpy, eur/jpy, etc.). It's amazingly simple. For the longest time I looked at larger time frames for trend determination, but that's only a part of it. The strategy is based mainly on 4-hr(240-min) chart support and resistance. The reason is that the mid sized and larger players consider time frames below the 4-hr chart noise. This is the chart they use to make determinations for entry. Here it is: Open a clean monthly char

$ Strength Returns...

Image
The dollar rallied and brought with it geppy(gbp/jpy) and eur/jpy. I managed to get in three profitable trades: gbp/jpy for +72, gbp/usd for +22 and eur/jpy for +24. All trades took no longer than three hours start to finish. Not bad.

Boring Night...

Image
Good lord this was a boring night of trading. Everyone was focused on what was going to happen to Freddie Mac and Fannie Mae up until early today when the Fed released it's Backstop(bailout) Plan for the beleaguered mortgage giants. Add to that the IndyMac Bank failure news and you get a market that doesn't know which way to go. I was able to scalp a couple of trades. One was a usd/chf (swissy) trade for +8 and the other shown below for +18 on eur/usd. Better than a loss any day.

More Good Trading...

Image

Crazy Good Night...

Image
It was an incredibly crazy session with four trades triggering almost simultaneously. All ran to profits. Very nice. It makes for a very nice weekend.

Cruelest of All Losses...

Image
Dear God...this is the cruelest of all losses and the most frustrating from my point of view. The trade was entered short on USD/CHF at 1.0337 after the breakout and pullback of the Asian session low. Price went slightly in my favor then retraced to my stop to the pip. Price then changed direction and ran lower for what would have been a tidy profit. Not a big deal, just one trade in a very long series of trades. None the less, it's very frustrating to be so close to a nice runner yet be stopped out by one stinking pip. Ah well...next bus then?

Market Bites Back...

Image
This GBP/USD trade didn't work out. I followed my trading plan exactly and took the breakout low of the Asian session. Price moved lower initially and I was feeling pretty good that this trade would work out well. The market certainly had other ideas. I was fortunate to peel off 1/3 of my position at +8. Unfortunately, the other 2/3 of the position ran up to my stop for -21. This is the way it goes sometimes. You have to plan your trade and trade your plan. That's exactly what I did here. So even though the trade was a loss from a monetary point of view, it was a win from the point of view of sticking to your trade plan. Losses happen. They're a part of the business. To be fair, there are some extenuating circumstances that may have contributed to the poor financial out come of the trade. First off, Trichet from the Euro Central Bank(ECB) gave testimony during the trade. He's the top dog where the euro is concerned. His testimony can sometimes make the market unstable a

Not All That Great...

Image
This session was not all that great though much better than a loss any day. The session begn by seeing most of the pairs I monitor already making moves by breaking out of their respective Asian ranges earlier than normal. The one that was in play was USD/CHF(US dollar vs Swiss Franc). I missed the break out of the Asian low at 1.0444 for some reason I can't recall now. Fortunately, it didn't run off too far before pulling back to create an entry opportunity. I set a sell limit for 1.0435 and was triggered into the trade shortly. The rest is annotated on the chart.

New Currency Pairs Line Up...

I've added and removed a few currencies from the line up of daily monitored pairs. The pairs I monitor as of today on a daily basis are EUR./JPY, GBP/JPY, GBP/USD, EUR/USD, USD/JPY, EUR/CHF, USD/CHF and GBP/CHF. Each day I start off by marking the previous day's high and low using a dashed horizontal line. I also set fib retracements on the daily charts along with nearby horizontal support and resistance levels from the same daily charts. The daily pivots are added by an indicator. Asian over night ranges are marked on the 15-min chart. The Asian range is defined from midnight GMT to 7:00am GMT. At this point I wait for a break out of the Asian range high or low, and jump on for the ride. They don't all work out, but enough of them do that it put the probabilities in my favor. That gives me the edge I need to profit from the market.

Another Nice Runner to Start The Week...

Image
Though this trade worked out very well, I'm some what upset that I missed entries on two other trades that ran off very nicely: GBP/USD at 1.9690 and USD/CHF at 1.0390. Both were break out of the over night Asian range.

Two Recent Trades...

Image
Apologies for not having posted in over a month. Trading has been going along quite well. These two trades were from Friday 06/20/2008. The trade above was a short of GBP/CHFon a break out of the over night Asian range. As you can see this trade ran quite well. The trade above was a short of USD/CHF on a break out of the Asian over night range. It too ran quite well for a total of +44 after price moved a bit shorter, then retraced.

No Losses So Far...

Image
No losses so far this month thanks to patience and discipline in waiting for nice setups like this on geppy (GBP/JPY):

Tonight's Trade: A Bit of Divergence

Image
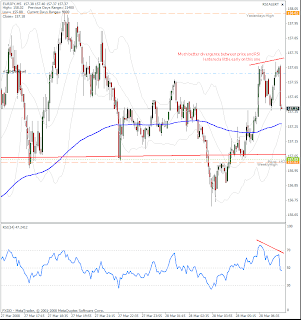
I firmly believe divergence is one of the best signals in all of trading. Here's my latest trade. I closed the remainder at +45:

Second Trade from Maui, Hawaii...

Image
I thought it would be pretty great trading from Maui, bu t this trade was just great. Another RSI(14) divergence trade on EUR/JPY. This one ran off to the tune of +81 when it was finally closed. There were some scale outs along the way.

Relocation Completed...

We've mostly finished our relocation to Maui, Hawaii. We move into our newly rented home on April 28th. It's very exciting. I don't have an office yet so we've been basically vacationing doing things like snorkeling, hiking and generally taking care of all the stuff that needs to be done to set up a life style in an entirely new location.

RSI(14): The Way to Success...

Image
In earlier posts I've shown a strategy of using the RSI(14) as a trigger to enter trades when it reaches extremes of 30/70. What I didn't realize until reading an old article by J. Welles Wilder, the creator of the RSI indicator, was that it was developed by him as a divergence indication of price and strength of RSI signal. I have been trading this signal with 5-min charts on EUR/JPY and GBP/JPY and it has been incredible. The idea is that you have to combine the divergent RSI with another solid support or resistance level such as monthly/weekly/daily high/low, daily pivot, S/R pivots, round number or fib level. Here are a couple of examples:

Some New Stuff...

First off, I've abandned the stochastics I added to the charts just a month ago. I found nothing of value in their addition. The next thing is I've been looking at a new methodology showed to me by the hedge fund trader I blogged about just a few posts ago. It's called the Market Matrix and it's an offshoot of the Delta Phenomenon developed by Jim Sloman and J. Welles Wilder in the early '80s. The Market Matrix has been developed by Steve Copan. It involves cycles within the lunar month and lunar year. It also involves counting the number of points within the lunar months and then predicting where the next turn of the cycle will be. I don't understand it completely and until I do it will stay as a system in development in my arsenal.
Image
Tonight we get to see how a losing trade progressed. I saw a valid signal, though not as high as I would like but price had made a higher high and still had just barely touched the RSI(14) 70 level. This is what I term divergence and usually a pretty solid signal. Price moved against me to -12 at one point. No big deal. Price has now moved back in my favor to about +4: Price has now moved back into negative territory and I'm beginning to feel it may be a failed signal: I've annotated where I exited the trade as price broke back above the previous high, but not as high as my stop loss. I thought I should cut my losses at this point. Well, I was wrong as price turned around and came back down into profits again where it is as I write this post. I made a couple of errors in this trade that brought it from a winner to a loser. One is I was unprepared to trade AUD/USD. I didn't know where the pivots or nearby high/lows. The other is I didn't stay with my stop loss. Had I sta

Strategy Additions...

Image
This past weekend was pretty cool. Friday night I went to a birthday party across town and met a professional hedge fund trader based out of Beverly Hills, CA. Our conversation lasted several hours and was eye opening and validating at the same time. The validation came in the revelations that we both have similar styles of trading and suffer many of the same trading maladies from time to time like impatience and greed. I also was given a book to read from another trader friend called 'Overcoming the 7 Deadly Trading Sins' by Ruth Barrons Roosevelt. It is an excellent read if you are having any kind of psychological troubles with trade management or money management. It reminded me of a few things I should be focusing on. Anyway, the hedge fund trader gave me a heads up on adding a couple of stochastic indicators to my charts to compliment the use of the RSI(14). As we've seen, the RSI(14) can find itself in no mans land(around the 50 level) where it's anyone's gues

Relocating To Maui, Hawaii...

That's right, we're relocating to Maui. Trading has been going so well that it's time to take it to the next level. We've put the house on the market and have offers as of this date. Hopefully, we'll be relocated Maui by April 15th or so. It's going to be a great experience trading full time from Maui. My hours of trading will be from approximately 7:00pm to 3:30am. Sleep until 11:00am. Exercise, meditate, surf, swim. Review the days financial and economic news and get ready to trade. Finally....the end of working two jobs. Hawaii is about the most stress free place to trade from that I can imagine. I'll be purchasing some additional equipment to bring my office up to snuff. Two 24" monitors, a small flat screen TV for CNBC financials and a new chair.

Like Shootin' Fish in a Barrel...

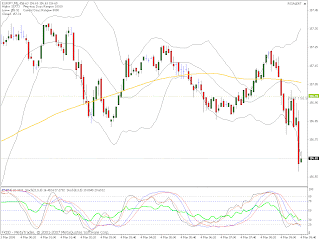
Image
I know it's been a while since I've posted but I lost interest in the blog as no one comments or has even found it out there. Oh well. I've been working hard at my trading and it's been going very well. This trade is one I entered tonight at 10:45pm PST. The RSI(14) was at an extreme overbought level and coming down. Price was showing no signs of finding bids higher up. I entered at 156.18. Shortly thereafter price fell like a rock. The trade was closed at +54. Here's a series of screen caps showing the trade progression: