Posts

Showing posts from 2017

Bull Flag on GBPJPY

Image
GBPJPY showed a bull flag that built up over the last several hours. The breakout was a fundamental event by BoE's Carney which led to this massive move in Geppy.

Hedge Fund Currency Trader Tips For Finding Trades

Tips from Art K. Hedge fund currency trader trader gives some tips on how he goes about finding high value / lower risk trades. (circa 2008)  Here are some ideas from Art K. as to how to go about preparing to find a good, high probability entry. He's a serious hedge fund pro.: One of my regular (technical) port of calls is to the Dollar Index to see what that’s up to. It’ll offer a snapshot of $ weakness v/s strength. You might then choose to cherry pick your candidate of choice if it's playing ball & quickly then proceed to leaf through the appropriate pairs to adjudge a likely opportunity. For instance, if the buck is weak v/s the basket, I’d want to be homing in on the candidate which is displaying the dominant & aggressive behavior patterns.  If it’s the Pound, then I’ll trail through the cross instruments associated with the Pound to locate whether it’s also a Pound story (of strength) or exclusive to the buck. I’m always on the hunt for value v/s r

Best Entries for Today

Image
I thought I should post couple of potential entries I spotted but did not enter . Both charts show the potential of price action trading even in tight markets. I generally keep a pretty simple chart with no indicators except a 50sma or 60sma, just horizontal support and resistance levels, previous day's high/low, previous week's high/low, previous month's high/low, and maybe some fibs or trendlines. AUD/USD M15 Chart EUR/USD M15 Chart

Forex Price Action Trading Strategy

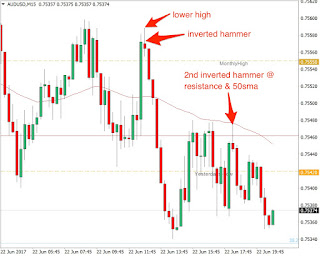
Hi all, After a very long absence I've come back to currency trading.  My last account was re-appropriated to fund living expenses after I was diagnosed with stage 3 non-Hodgkin Lymphoma. I was under insured and medical expenses can be onerous at best. I thought I should post my latest price action trading strategy. I've been focusing on short term scalps, trading off the M15 chart for entry signals. Support and resistance levels come from D1 & H1 charts along with fib retracement calcs when appropriate. You'll also see from time to time lines that show the previous day's high/low, previous week's high/low and previous month's high/low. Price Action Strategy Charts Mark nearby round numbers (D1, H1) Mark nearby swing points (D1, H1) Place fibs on chart (H1, 15m) Signals Price @ swing S/R level with hammer or outside engulfing candle Price @ round number S/R level with hammer or outside engulfing candle Price @ 50% or 61.8%