Posts

Showing posts from 2009

Two New Trading Resources...

Well they aren't all that new, but they offer some of the best trading instruction on the web .  This first link is to a site called BabyPips. You can ignore nearly all the other forum threads except this one. Pay particular attention to posts by Tess, Jocelyn, Andre, Sean and Jimmy. They all work together at a medium size currency focused hedge fund with offices in NY, London, and Hong Kong. What they offer is a price action based template for trading the markets that works in nearly any market condition: http://forums.babypips.com/free-forex-trading-systems/19076-technical-templates-2-a-new-post.html The second link is to a web site called Forex4Noobs. Sounds really lame, but they have some excellent resources and most of it is free. Pay attention to posts from Fetor. He has a blog and other resources offering training along the same lines as the group from BabyPips. Go here: forex4noobs.com

Good and Bad...

Image
This was an excellent entry for a short on GBP/USD. Nice bear flag. Two gravestone dojis in a row. Top it off with a bit of the UK's Mervyn King spouting off about how the UK growth will not be all that great and you have the recipe for a highly profitable trade. If you go take a peek at the daily chart you'll see yesterday's daily candle is a bearish shooting star just looking for a reason to be pushed off the cliff. To be honest this trade did give a little bit of a scare as it charged up past the entry. Stop loss was placed above the recent high. The bad of this was leaving 80+ pips on the table. Price ran down, took my limit at 1.6300 and kept right on chugging.

RSI Divergence Again...

Image
Absolutely crushed this one. Knocked it out of the park. Perfect RSI divergence set up off the daily chart 38.2% fib. Couldn't be any happier the way this trade worked out.

RSI Divergence Is Back...

Image
This market has been a real bear with tight ranges and volatility that borders on insane some times. It's these times when it's good to be familiar with more than one solid setup. I've used this in the past. It's the RSI divergence set up on the 5m chart. The trick is to use this only at S/R levels from the higher time frames(daily, 4-hr and 60m). It can provide a nice tight entry with limited risk. If you look, you'll find several setups across the major pairs every day.

AUD/USD Asian Session Trade

Image
Nice AUD/USD trade to start the day. Same formula as usual.

Cable to the Rescue...

Image
During an incredibly slow Asian session I was fortunate enough to find this little nugget. A nice short entry off a lower high at the weekly high. Inside bar on the 5m chart was my signal. Price sat there not moving for nearly three minutes then dropped very quickly.

Eur/Jpy Winner Again...

Image
The change of hours to the Asian session has worked out well so far. This trade was initiated just minutes after the Asian open. To be honest, when the large drop happened just prior to the open I was a bit dismayed thinking I may have missed the start of the next leg down. But then price found a bit of support. I looked for another test of the now previous day's low, found it and along with extra confidence from the divergence on the 5-min RSI, the trade was entered into. It traveled nicely up to the daily pivot at 127.20 and then a bit past it.

Eur/Jpy Winner

Image
Fairly simple trade. Waited for Japan to come online, bringing with it better liquidity and lower spreads. 129.00 was busted and re-tested on a pullback which is where I jumped in with a short entry at 128.95. Price moved quickly in my favor. I did leave about 20 pips on the table, but price was in RSI oversold zone when the 5-min inside bar formed near 128.50. Exited the position for +45.

Tough Time Lately...

I've been having a tough go at trading as of late and by this I mean the two weeks have been break even trading. Up,down, down, up, down, up, etc. No gain at all. What to do about it? Review the trade logs and daily journal. What's changed? Is it me? Has the market subtly shifted away from my strategy? The one thing that sticks out is a progressing lack of sleep during the week. The pattern is something like this: I arrive the screens on Sunday evening totally refreshed from two days of rest and a good eight hours of sleep each night. I work late into the evening, maybe 2:00am trading as much of the London session as possible for me. I get about 6-7 hours of sleep. Monday I trade from 6:00pm until 1:00am and I'm zonked. I get about 5-1/2 to 6 hours of sleep. At this point on Tuesday I'm really tired and make sure to take a nap in the afternoon. The nap lasts about an hour. I start trading at 6:30pm and finish at 12:30am when I am whooped. I notice that even though I tak

Nice Start To The Week...

Image
Actually had a couple of profitable trades this session. This was the best. Price action was difficult at best and I was fortunate to get on board for this pop higher.

Critical Analytical Error...

Image
I made a critical analytical error on my geppy charts by not realizing the hourly fib levels were not updated. Had the fib levels been updated, my analysis would have been to take a long position. I can't win 'em all, but I certainly will try to.

Geppy!...

Image
This was a classic IB entry on the 5-min GBP/JPY chart. Previous day's high at 140.50. Price was rejected at 141.00 35 minutes earlier. The IB helped form the lower high for a run back down to test the ascending trendline which starts at yesterday's low of ~135.80. This yielded a nice profit. I really wish all trades were this easy and smooth.

Sunday Starts Early...

The session got off to a roaring start today and didn't let up. Cable and Geppy both plowed lower from the opening bell in New Zealand. I didn't find much opportunity from a couple of hours before the London open through the lunch hour. I managed to scalp off about 25 pips on trades I thought had a decent chance of turning into a retracement moves on cable. No go. I've been concentrating on cable as my main focus lately. It might do me well to head back over to the geppy camp. It's been running pretty nice the last few sessions. I'll be keeping a closer eye on it this week. It's looking like the GM news of the Obama Administration rejecting their latest plan, yet offering more cash for restructuring(though not through bankruptcy) will take it's toll on the U.S. market Monday morning. Futures are already in substantial negative territory. There is a long shot outlook that the market could view it as a positive in that possibly more of the deadwood that's

Outta Here...

I'm out of here until Sunday evening(Monday morning Euro/London). There's not too much going on with end of Q1, end of the Japanese fiscal year and G10 this weekend [I meant to write G20. And it's not this weekend it's this Thursday. Sorry for the misinformation] addressing currencies. This should be an interesting meeting. I'll be keeping a keen eye on what ever statement they release and try to have a reasonable analysis together before the start of next week. Don't forget that the UK switches to BST(GMT+1) this Sunday at 1:00am. This means everything starts an hour earlier for me. Thank God. Every so often I miss moves because they happen an hour after I sign off for the session. Have a great weekend!

End of Q1 Blues...

Image
Oh. My. God. Price action was so crazy tonight I can honestly say it was un-tradeable on a short term basis. I was able to get this long trade early on. Thankfully it ran far enough for a scale out at +38. At least it was profitable :-) I can only suspect this hodge podge of price action was the result of book squaring in anticipation of the end of Q1. It may continue like this through the end of the week. I sincerely hope not.

Better Than A Loss...

Nothing good to report except that I didn't take a loss. Nor did I have any profits. GBP/USD traded in a tight range during the very late Asian session to the mid-morning London session. I got caught in a couple of trades that looked like good setups and took two small losses. Fortunately, at the very end of the session I was able to find a nice little 40 pip runner that brought me back to break even. Whew! Tonight should be much better. Something I didn't touch on in the post on strategy from a couple of days ago are exits. Particularly where to exit and how much. I'm pulling some thoughts together as I realize this is a real weakness in my trading. They're discretionary(not a bad thing), but sometimes much too early and without reason. I'll address this in an upcoming post.

Good, But Could Have Been Better...

Image
This was a very nice entry and scale out. Unfortunately, I moved my stop too tight in regards to price action. Cable can really be a mover and I didn't give it enough room. Stop loss should have been kept at entry. It was a 50 pip pullback. That's really no surprise on cable. Time to look for my next opportunity .

Strategy Recap...

Since my trading strategy has morphed somewhat over the last few weeks, I thought now might be a good time to post a recap for further explanation. At this time, I'm only monitoring two pairs: GBPUSD and GBPJPY. GBPUSD has been moving briskly over the last couple of weeks, providing plenty of opportunity to bring home the pips. GBPJPY, normally a volatile pair, has been giving off fewer clear signals and has a reduced range over the last couple of weeks. I would describe my strategy as a discretionary bag of tools of which there are three or four that get used over and over depending on the situation. The strategy I employ consists of a top down approach. This means I start by analyzing the higher time frame charts, then drill down to lower time frame charts. I use candlestick patterns on the lower time frames to pinpoint entries using inside bars, outside bars, spinning tops, hammers, inverted hammers, etc. I start my analysis with the weekly chart, marking the previous weeks hi/l

Fine End to the Week...

Image
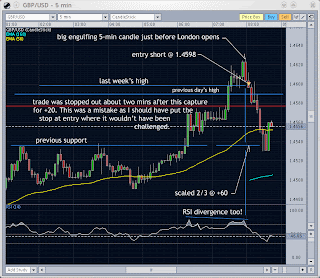
After a tough week of missing several excellent entries, I finally caught a couple of good ones in a row. The first was a break of the 1.4500 round number. Unfortunately, I was not able to grab the optimal entry at the bounce off the 4-hr 50% fib retracement. Still it was a good profitable trade. The second trade was the one I'm really proud of. I recognized price was making a play for the previous day's high(and weekly high) at 1.4597. In particular it made it's push in the last 15-mins before the London open and failed not only to reach the 1.4600 round number, but also failed to reach 1.4597 previous day's high. I took a short entry off an inverted hammer on the 5-min chart and the rest is history. Nice bit of profits added to the account.

Crazy Price Action This Session...

Image
Wow! Price action has been crazy this session so far. That tells me the market may be illiquid until the rate announcement from the U.S. Wednesday morning and GBP MPC minutes are released later this session.

No Trades on Tuesday...

It so happened I missed an early bird signal and wasn't able to find a comfortable place to jump in the mix yesterday.

Cable Runs Nicely...

Image
Very nice trade on GBP/USD(aka cable). Entry @ 1.4032 above 4-hr horizontal S/R and 23.6 fib retracement taken from the 60-min chart. Cable had been trending up nicely since the New Zealand open. The run up was helped by buy triggers the big boys had in place. From ForexLive.com: Sources report good “Russian” interest for cable this morning and particularly strong buying interest from one particular UK corporate. Technical resistance is now seen lying up at 1.4170/75. I closed out this trade at 1.4102 for +70. Trading three full lots equates to $2100. Not a bad haul for just shy of two hours work. Not all sessions are this quick and easy. The pendulum swings both ways.

Long, Tough Session...

Wednesday's session was difficult to get a entry I believed would move in my chosen direction. The trend for both GBP/USD and GBP/JPY was down overall. Both were slowing their descents by the time London opened for business. Movement was slow for GBP/USD covering very little ground on it's inevitable march upward. UK Trade Balance data was released and shown to be negative. I waited for a drop that never came. Finally, I found an Inside bar formation that looked to fit the bill. No go. I took a loss for -16 when the subsequent candle invalidated my entry. That was the extent of my trading for Wednesday. I couldn't reconcile the price action of a stronger GBP to the poor Trade Balance data. Hopefully, the tea leaves will be clearer for today's session.

Great Post on Candlestick Patterns...

FXWords.com has a great couple of pages on candlestick patterns. Their examples don't just show the pattern, but also show a series of candles before and after the pattern to help visualize just what you may see.

Fantastic Trading Strategy Posts...

I've come across a fantastic forum thread over at Babypips.com called Alternative Technical Templates . It's run by a few savvy currency hedge fund traders with a good bit of experience. One of the few forums where real pro traders are selflessly giving the best advice. Read it and you'll become a much better trader.

Cool Forex Blog...

I've been following a pretty good forex blog lately called Forex Live . It's put on by some of the guys that ran Rueter's now defunct FXHub. This is one(the only?) of the few blogs that actually posts information on money flows into the market and what area of the world they're coming from. Check it out if you get a chance.

Not Exactly What I Wanted...

Image
This trade started off good enough with an entry based on a lower high with an inside bar(IB). It ran down to +23 where I scaled a portion and moved my stop to entry. It eventually moved to +35 or so and retreated back up to take my stop. At least I ended up with a slight bit of profit. Better than a loss any day. These types of trades happen. They seem to take place after days where there are huge moves, like yesterday. I think there's just a lot of indecision in the market as it digests what to do next. Another post 'Big Day' pattern I've noticed is the smoother, more predictable moves happen at around 4:00am GMT. Why? I have no idea other than Asian traders booking profits.

Price Weakness Leads To Profits

Image
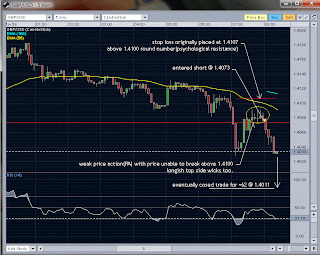
Tonight's trade is based on price weakness at a reasonably strong resistance level. Looking at the chart, we can see price had broken through the 1.4100 round number support which then turned it to resistance. Price then made a move back up to test 1.4100. This is where the market showed it's hand with a series of weak 5-min candles culminating with an inverted hammer on the 15-min chart at the London open. The trade was eventually closed for +62.

Inside Bar Entry

Image
This entry was taken when an inside bar showed up after price put in a lower high and the RSI(14) was very close to touching overbought 70 level. I scaled just over 1/2 the position at +26 and closed the remainder at +45 when the next inside bar showed up and the RSI(14) was touching oversold 30 level. This would have been a great close and reverse opportunity, but I was not quite ready to take it on. Hopefully next time. Overall, I wanted to stay with the longer term down trend on cable so I was looking for short opportunities on price pull backs. This session was a little slow compared to last night where price moved substantially lower. Unfortunately, I was returning from a weekend get away with the Mrs. and was unable to participate in that session.

Break Out Trade

Image
Tonight's trade was a classic break out long trade. The analysis of the chart showed a range on the 15-min chart with an ascending trend line derived from the 60-min chart. There was also a descending trend line derived from the 4-hr chart which price had broken through earlier in the day. Price had been rejected off the range low before I arrived at the charts and was sitting in the middle of the range. At this point I know what I'm looking for price to do before I'd consider engaging(a plan!) It has to break the range high and pull back for an entry limit to be placed. As price approached the range resistance, I moved down to the 89-tick chart. I use the 89-tick chart for a nice tight entry. What I have to see is price break the resistance line, then I wait for the first 89-tick bar to not make a higher high(the first red bar above the resistance line in the lower chart) and place my entry above the previous candle high. My target was 1.4400 which was hit for +105 pips. I
Alright, I'm going to try and post a little more often starting tonight. My trade explanations will have more detail and a couple of more charts explaining the thought process involved in putting on the trade. The plan is to transfer more information to this blog from my Tradesheet journal I fill out every night for every trade. In addition I hope to record some of my trades live a few times per week so everyone can see how trades progress in real time or as close to it as I can get.

RSI Divergence Set Up...

Image
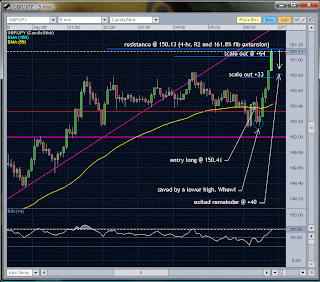
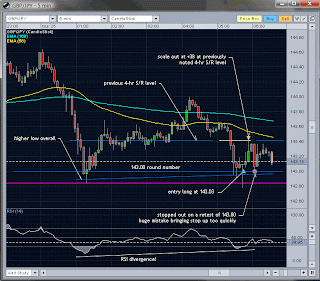
The old RSI divergence set up has started showing up regularly again now that volatility has receded somewhat. Here's an example of how I'm trading it. Explanation is on the image. If you have any questions, please leave them in the comments area or email directly. You can find my email in the profile area.