Posts

Bull Flag on GBPJPY

Image
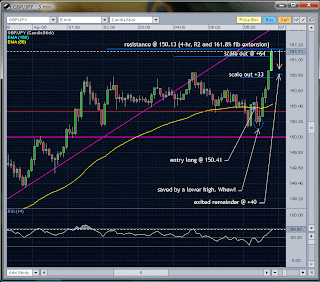
GBPJPY showed a bull flag that built up over the last several hours. The breakout was a fundamental event by BoE's Carney which led to this massive move in Geppy.

Hedge Fund Currency Trader Tips For Finding Trades

Tips from Art K. Hedge fund currency trader trader gives some tips on how he goes about finding high value / lower risk trades. (circa 2008)  Here are some ideas from Art K. as to how to go about preparing to find a good, high probability entry. He's a serious hedge fund pro.: One of my regular (technical) port of calls is to the Dollar Index to see what that’s up to. It’ll offer a snapshot of $ weakness v/s strength. You might then choose to cherry pick your candidate of choice if it's playing ball & quickly then proceed to leaf through the appropriate pairs to adjudge a likely opportunity. For instance, if the buck is weak v/s the basket, I’d want to be homing in on the candidate which is displaying the dominant & aggressive behavior patterns.  If it’s the Pound, then I’ll trail through the cross instruments associated with the Pound to locate whether it’s also a Pound story (of strength) or exclusive to the buck. I’m always on the hunt for value v/s ...

Best Entries for Today

Image
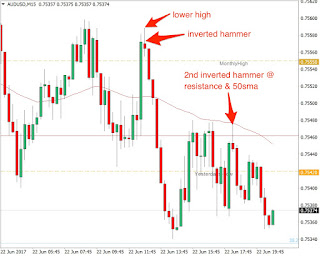
I thought I should post couple of potential entries I spotted but did not enter . Both charts show the potential of price action trading even in tight markets. I generally keep a pretty simple chart with no indicators except a 50sma or 60sma, just horizontal support and resistance levels, previous day's high/low, previous week's high/low, previous month's high/low, and maybe some fibs or trendlines. AUD/USD M15 Chart EUR/USD M15 Chart

Forex Price Action Trading Strategy

Hi all, After a very long absence I've come back to currency trading.  My last account was re-appropriated to fund living expenses after I was diagnosed with stage 3 non-Hodgkin Lymphoma. I was under insured and medical expenses can be onerous at best. I thought I should post my latest price action trading strategy. I've been focusing on short term scalps, trading off the M15 chart for entry signals. Support and resistance levels come from D1 & H1 charts along with fib retracement calcs when appropriate. You'll also see from time to time lines that show the previous day's high/low, previous week's high/low and previous month's high/low. Price Action Strategy Charts Mark nearby round numbers (D1, H1) Mark nearby swing points (D1, H1) Place fibs on chart (H1, 15m) Signals Price @ swing S/R level with hammer or outside engulfing candle Price @ round number S/R level with hammer or outside engulfing candle Price @ 50% or 61.8%...

EURGBP Short

Image
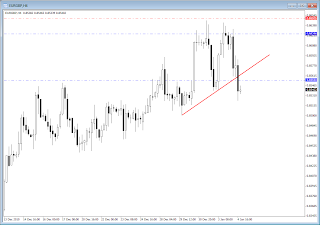
OK, here we go. The H4 candle came out a shooting star at resistance. This trade brings with it a bit more risk in being that it's a counter trend trade with the idea that price will come back to the ema mean as shown in the image below: Daily EURGBP chart UPDATE: Got totally whacked on this one. No pullback whatsoever.

AUDUSD Short

Image
Here's another trade that worked out pretty well except it missed target. Still, it was closed at better than 1:1. I reduced target distance from entry after considering why the last trade posted did not make target. Hopefully, the next trade will finally make it to target. 

USDCAD Short Trade

Image
This trade started off well enough, but ran into what looks to be firm resistance though it could be just profit taking before the weekend. Closed the trade for just better than 1:1. I'm going to do some work on profit target analysis over the weekend.

EURGBP Short on H4 Chart

Image
Double top with second top being a slightly lower high than the first. Inside shooting star candle pattern. Out at TP for ~ +110. Stop loss was 35 pips.

Sorry...

I apologize as I've let my blog go fallow. I can assure you the next post will be truly amazing. I have a method now to trade eur/usd, 6E (euro futures) and the S&P e-mini futures that is repeatable, mechanical and very consistent. Other important changes are that I'm trading 6E euro future for the most part. The spot forex market has it's place, but not until sometime in the future. I'm using Think or Swim charts from TDAmeritrade. They run on a Mac. Nice.

Two New Trading Resources...

Well they aren't all that new, but they offer some of the best trading instruction on the web .  This first link is to a site called BabyPips. You can ignore nearly all the other forum threads except this one. Pay particular attention to posts by Tess, Jocelyn, Andre, Sean and Jimmy. They all work together at a medium size currency focused hedge fund with offices in NY, London, and Hong Kong. What they offer is a price action based template for trading the markets that works in nearly any market condition: http://forums.babypips.com/free-forex-trading-systems/19076-technical-templates-2-a-new-post.html The second link is to a web site called Forex4Noobs. Sounds really lame, but they have some excellent resources and most of it is free. Pay attention to posts from Fetor. He has a blog and other resources offering training along the same lines as the group from BabyPips. Go here: forex4noobs.com

Good and Bad...

Image
This was an excellent entry for a short on GBP/USD. Nice bear flag. Two gravestone dojis in a row. Top it off with a bit of the UK's Mervyn King spouting off about how the UK growth will not be all that great and you have the recipe for a highly profitable trade. If you go take a peek at the daily chart you'll see yesterday's daily candle is a bearish shooting star just looking for a reason to be pushed off the cliff. To be honest this trade did give a little bit of a scare as it charged up past the entry. Stop loss was placed above the recent high. The bad of this was leaving 80+ pips on the table. Price ran down, took my limit at 1.6300 and kept right on chugging.

RSI Divergence Again...

Image
Absolutely crushed this one. Knocked it out of the park. Perfect RSI divergence set up off the daily chart 38.2% fib. Couldn't be any happier the way this trade worked out.

RSI Divergence Is Back...

Image
This market has been a real bear with tight ranges and volatility that borders on insane some times. It's these times when it's good to be familiar with more than one solid setup. I've used this in the past. It's the RSI divergence set up on the 5m chart. The trick is to use this only at S/R levels from the higher time frames(daily, 4-hr and 60m). It can provide a nice tight entry with limited risk. If you look, you'll find several setups across the major pairs every day.

AUD/USD Asian Session Trade

Image
Nice AUD/USD trade to start the day. Same formula as usual.

Cable to the Rescue...

Image
During an incredibly slow Asian session I was fortunate enough to find this little nugget. A nice short entry off a lower high at the weekly high. Inside bar on the 5m chart was my signal. Price sat there not moving for nearly three minutes then dropped very quickly.

Eur/Jpy Winner Again...

Image
The change of hours to the Asian session has worked out well so far. This trade was initiated just minutes after the Asian open. To be honest, when the large drop happened just prior to the open I was a bit dismayed thinking I may have missed the start of the next leg down. But then price found a bit of support. I looked for another test of the now previous day's low, found it and along with extra confidence from the divergence on the 5-min RSI, the trade was entered into. It traveled nicely up to the daily pivot at 127.20 and then a bit past it.

Eur/Jpy Winner

Image
Fairly simple trade. Waited for Japan to come online, bringing with it better liquidity and lower spreads. 129.00 was busted and re-tested on a pullback which is where I jumped in with a short entry at 128.95. Price moved quickly in my favor. I did leave about 20 pips on the table, but price was in RSI oversold zone when the 5-min inside bar formed near 128.50. Exited the position for +45.

Tough Time Lately...

I've been having a tough go at trading as of late and by this I mean the two weeks have been break even trading. Up,down, down, up, down, up, etc. No gain at all. What to do about it? Review the trade logs and daily journal. What's changed? Is it me? Has the market subtly shifted away from my strategy? The one thing that sticks out is a progressing lack of sleep during the week. The pattern is something like this: I arrive the screens on Sunday evening totally refreshed from two days of rest and a good eight hours of sleep each night. I work late into the evening, maybe 2:00am trading as much of the London session as possible for me. I get about 6-7 hours of sleep. Monday I trade from 6:00pm until 1:00am and I'm zonked. I get about 5-1/2 to 6 hours of sleep. At this point on Tuesday I'm really tired and make sure to take a nap in the afternoon. The nap lasts about an hour. I start trading at 6:30pm and finish at 12:30am when I am whooped. I notice that even though I tak...

Nice Start To The Week...

Image
Actually had a couple of profitable trades this session. This was the best. Price action was difficult at best and I was fortunate to get on board for this pop higher.

Critical Analytical Error...

Image
I made a critical analytical error on my geppy charts by not realizing the hourly fib levels were not updated. Had the fib levels been updated, my analysis would have been to take a long position. I can't win 'em all, but I certainly will try to.