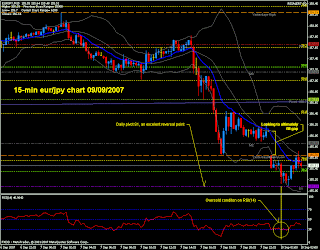
Here is the way I trade to make money. I apply this strategy to the four currency pairs I monitor. The strategy: Open a cable(gbp/usd) 5-min chart, set it to candlesticks, apply pivot indicator with standard(R3, R2, R1, P, S1, S2, S3) and mid-pivots(M1, M2,...) enabled. Apply the RSI(Relative Strength Index) indicator to the chart. Set it to 14. Set levels to 30, 50 and 70. 70 is overbought and 30 is oversold. Change chart to hourly peridocity and determine the dominant trend. It will be one of three things: ascending, descending or ranging. If the trend is not apparent, change to the daily chart and determine the trend. Mark it on your chart with a trend line. While at the daily and hourly charts, make note of support and resistance(s/r) levels. You can use previous highs/lows, fibonacci retracements, pivots, round numbers(00 or 50) or all of the above in any combination you find price reacts to. You can mark previous high/lows and round numbers on the chart with horizontal lines. As...


